

Through the analytics tab, you can find out information about how your students are doing in your course, set alerts, and add ‘notes’ about the student for your own record .
Analytics
Analytics are accessed from your top navigation bar and include Course Activity, Question Analysis, SCORM Reports.

Course Activity:
This report shows student performance and activity in your course. Overall grade and hours in course updates every 24 hours.
-
Instructors can select students to send a message.
-
Instructors can see: overall grade, hours in course, days since last access in a scatter plot or list.
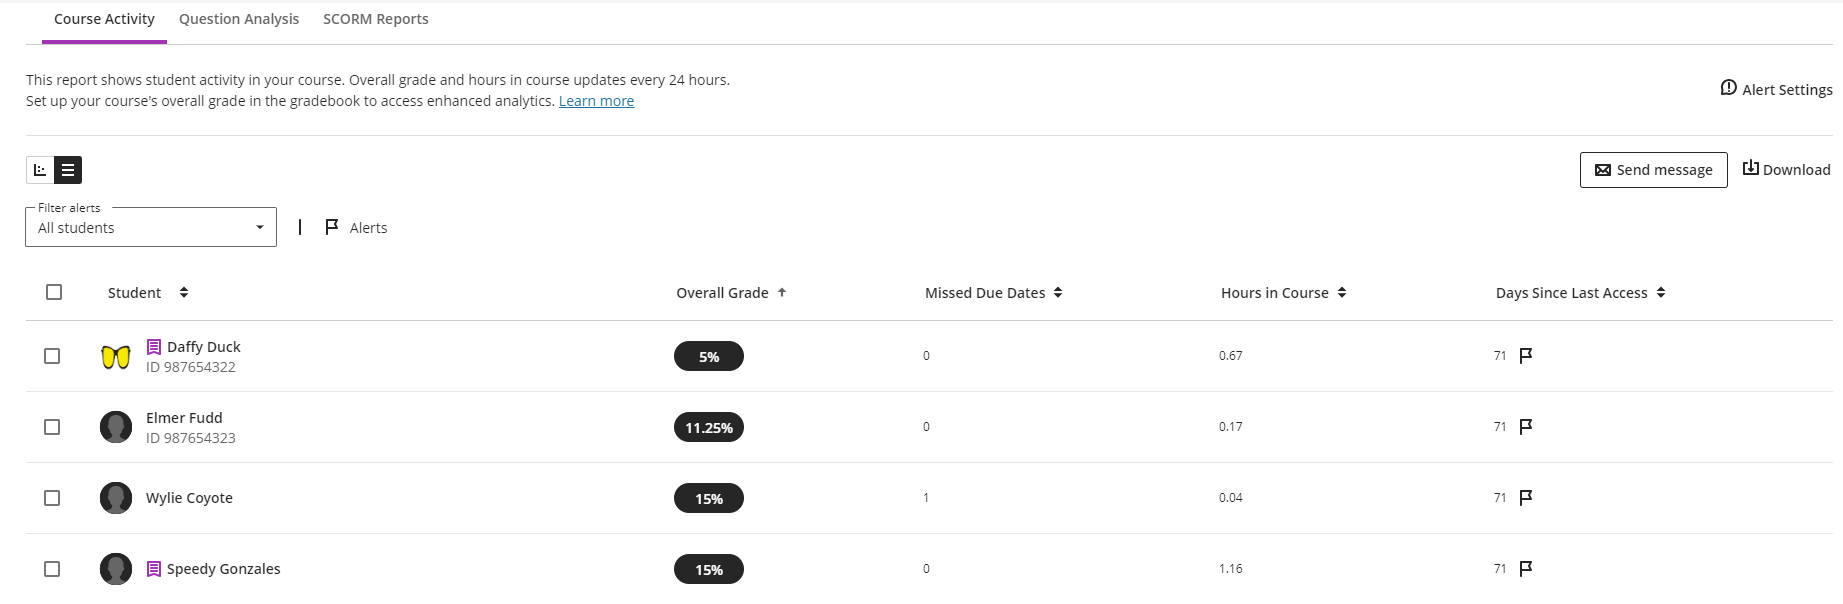
Individual student data within Course Activity
Click on an individual student’s names to check details on their performance.
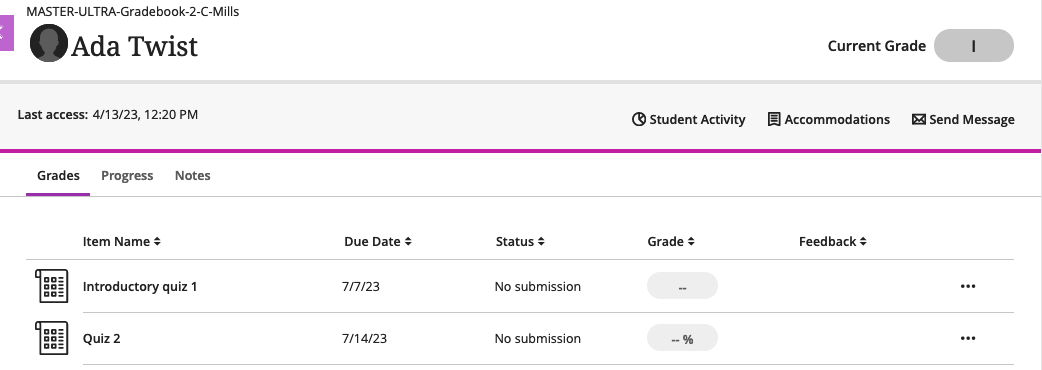
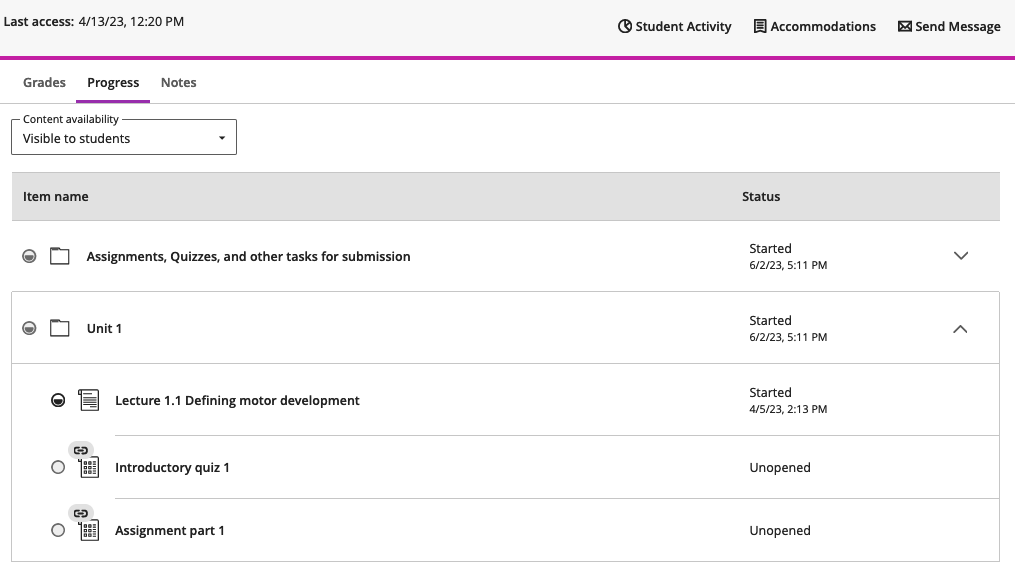
Progress: From this area, you can access student activity, manage accommodations, send course messages, view grades, and see activity from progress tracking (see image below).
Internal Notes: This feature allows instructors to log information about students that only instructors and administrators can view.
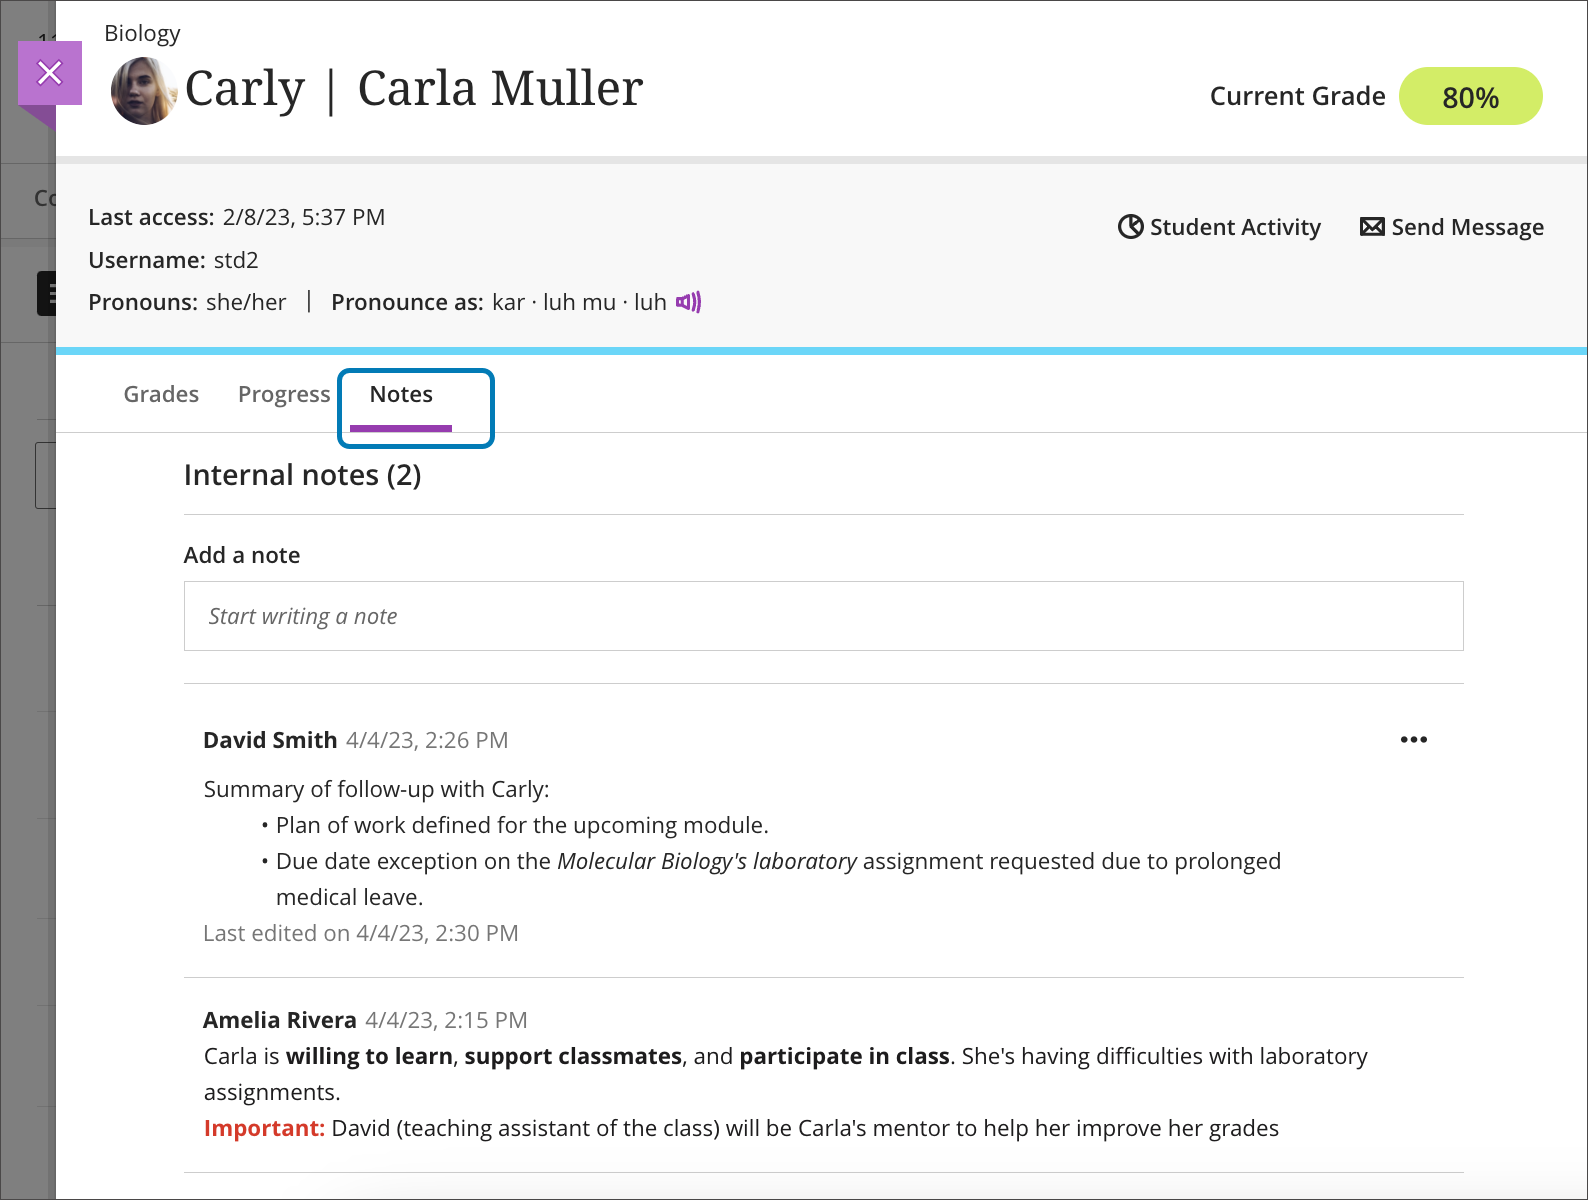
Note: while students cannot see these notes within Blackboard, students can request to see ALL information written in emails, blackboard etc.
You might want to use internal notes for:
-
Tracking students' progress throughout a course.
-
Documenting agreements you make with students like extensions on an assignment.
-
Incidents of academic dishonesty or any other behavioral issues.
-
Recording reasons for accommodations like medical leaves.
Grader Notes
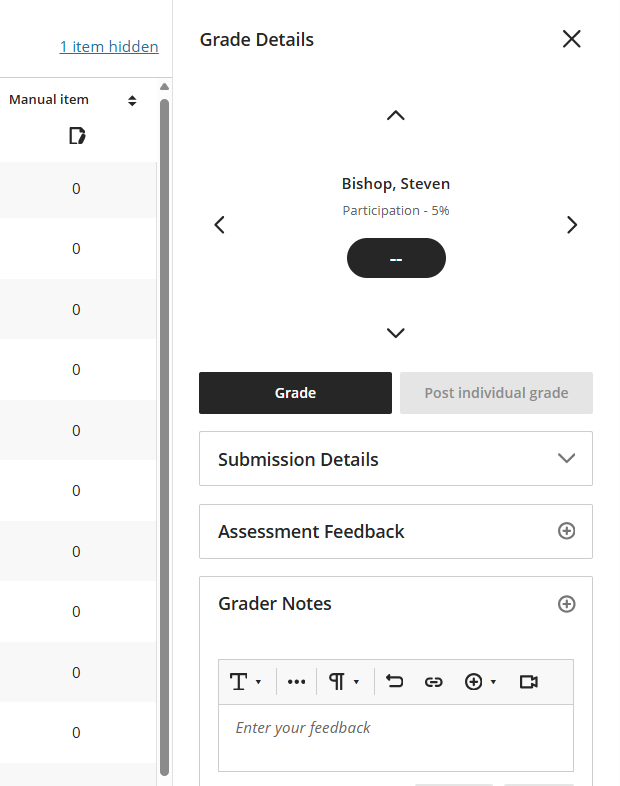
Instructors can add private grading notes to student grades in the Gradebook. Grader notes can be used as documentation for grading decisions or adjustments. They are not visible to students.
They can be accessed via:
-
Grid view > click on cell with specific score > Grader Notes
-
List view > assessment name > three dots (…) for specific student > Feedback & Notes
Graders have access to the content editor as well as directly add Audio/Video recordings.
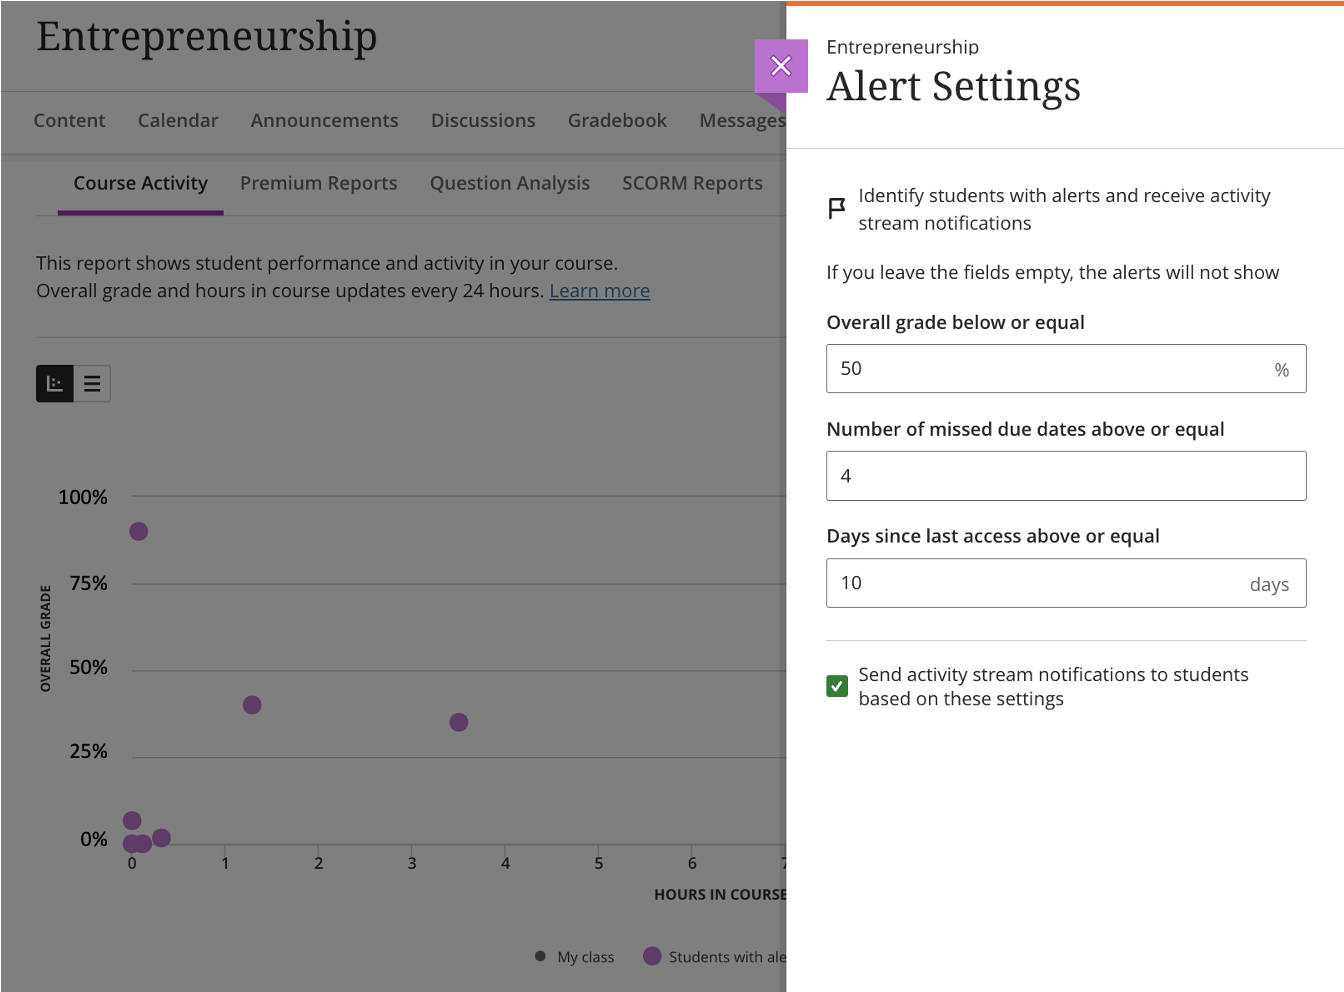
Alert settings
Note: Alerts are only visible by default to instructors. If instructors do not want alerts, they must be turned off. Students will not receive alerts.

-
You can add alerts for your courses for:
-
Overall grade below or equal (%)
-
Number of missed due dates above or equal
-
Days since last access above or equal
-
-
You can define your Alerts Settings (each course can have its own alerts values).
-
The default value for the number of days a student is inactive alert is 15. There is no default setting for overall grade or missed due dates.
-
Course alerts can be added, edited, and deleted at any time
-
Students with alerts will have a purple flag next to their name.
Question Analysis:
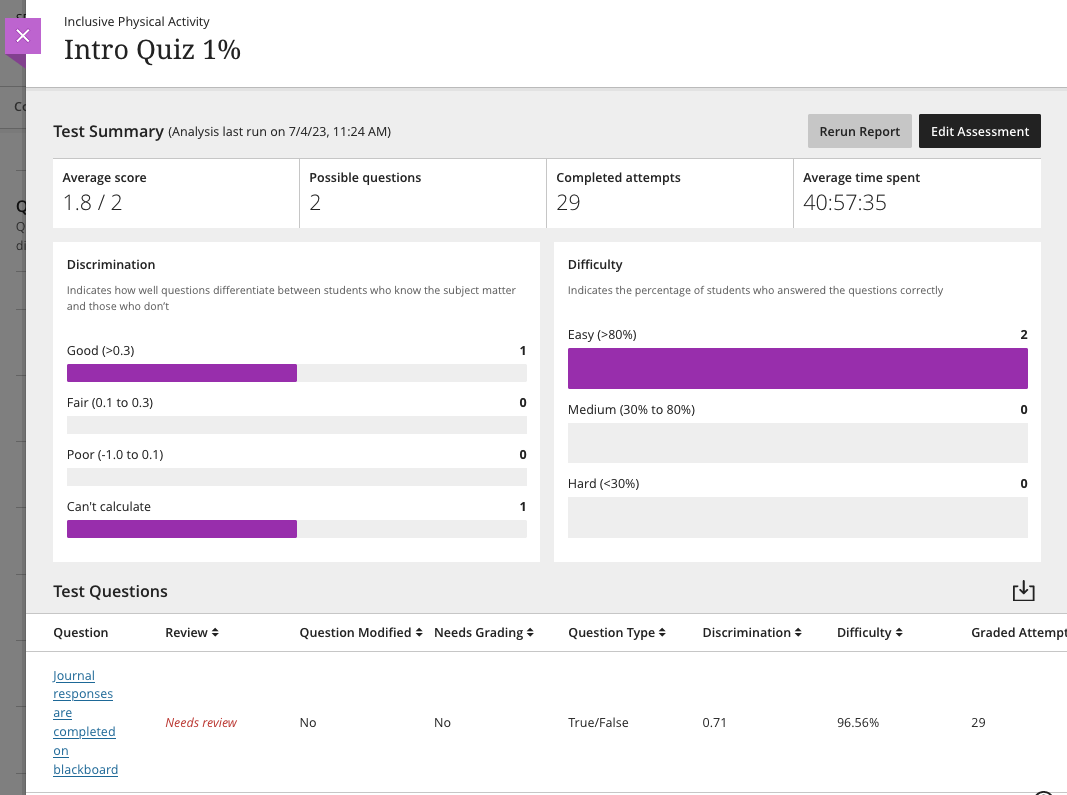
Question analysis provides statistics on overall performance, assessment quality, and individual questions. This data helps you recognize questions that might be poor discriminators of student performance. Reports expire after 14 days.
-
Select run report from the right side of the item you would like a report on
-
Status will change to ‘report in progress’; instructor will receive an email when report has been generated
-
Once report is completed, the title of your item will become a hyperlink. Click the hyperlink to view the report
Example question analysis report:
Statistics
To view Statistics, navigate to:
-
Gradebook > List View> three dots (…) > Statistics
-
Gradebook > Grid View > Click on Assessment name > Statistics icon > Statistics
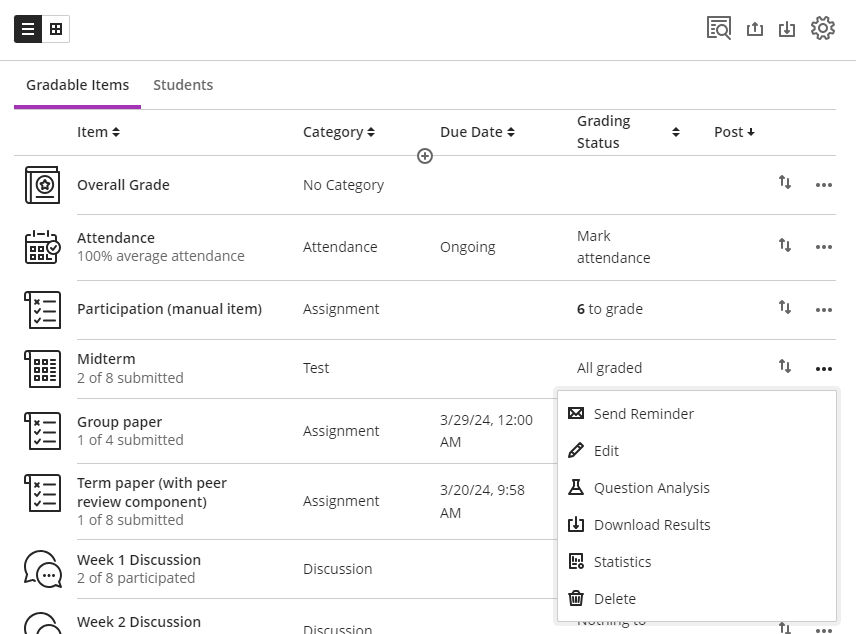
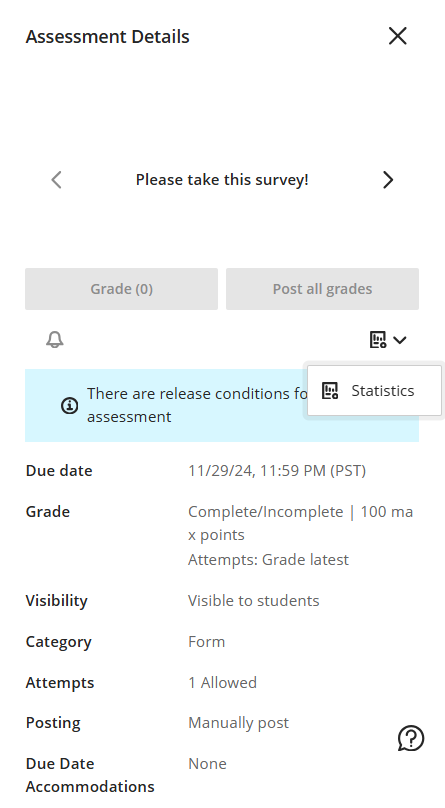
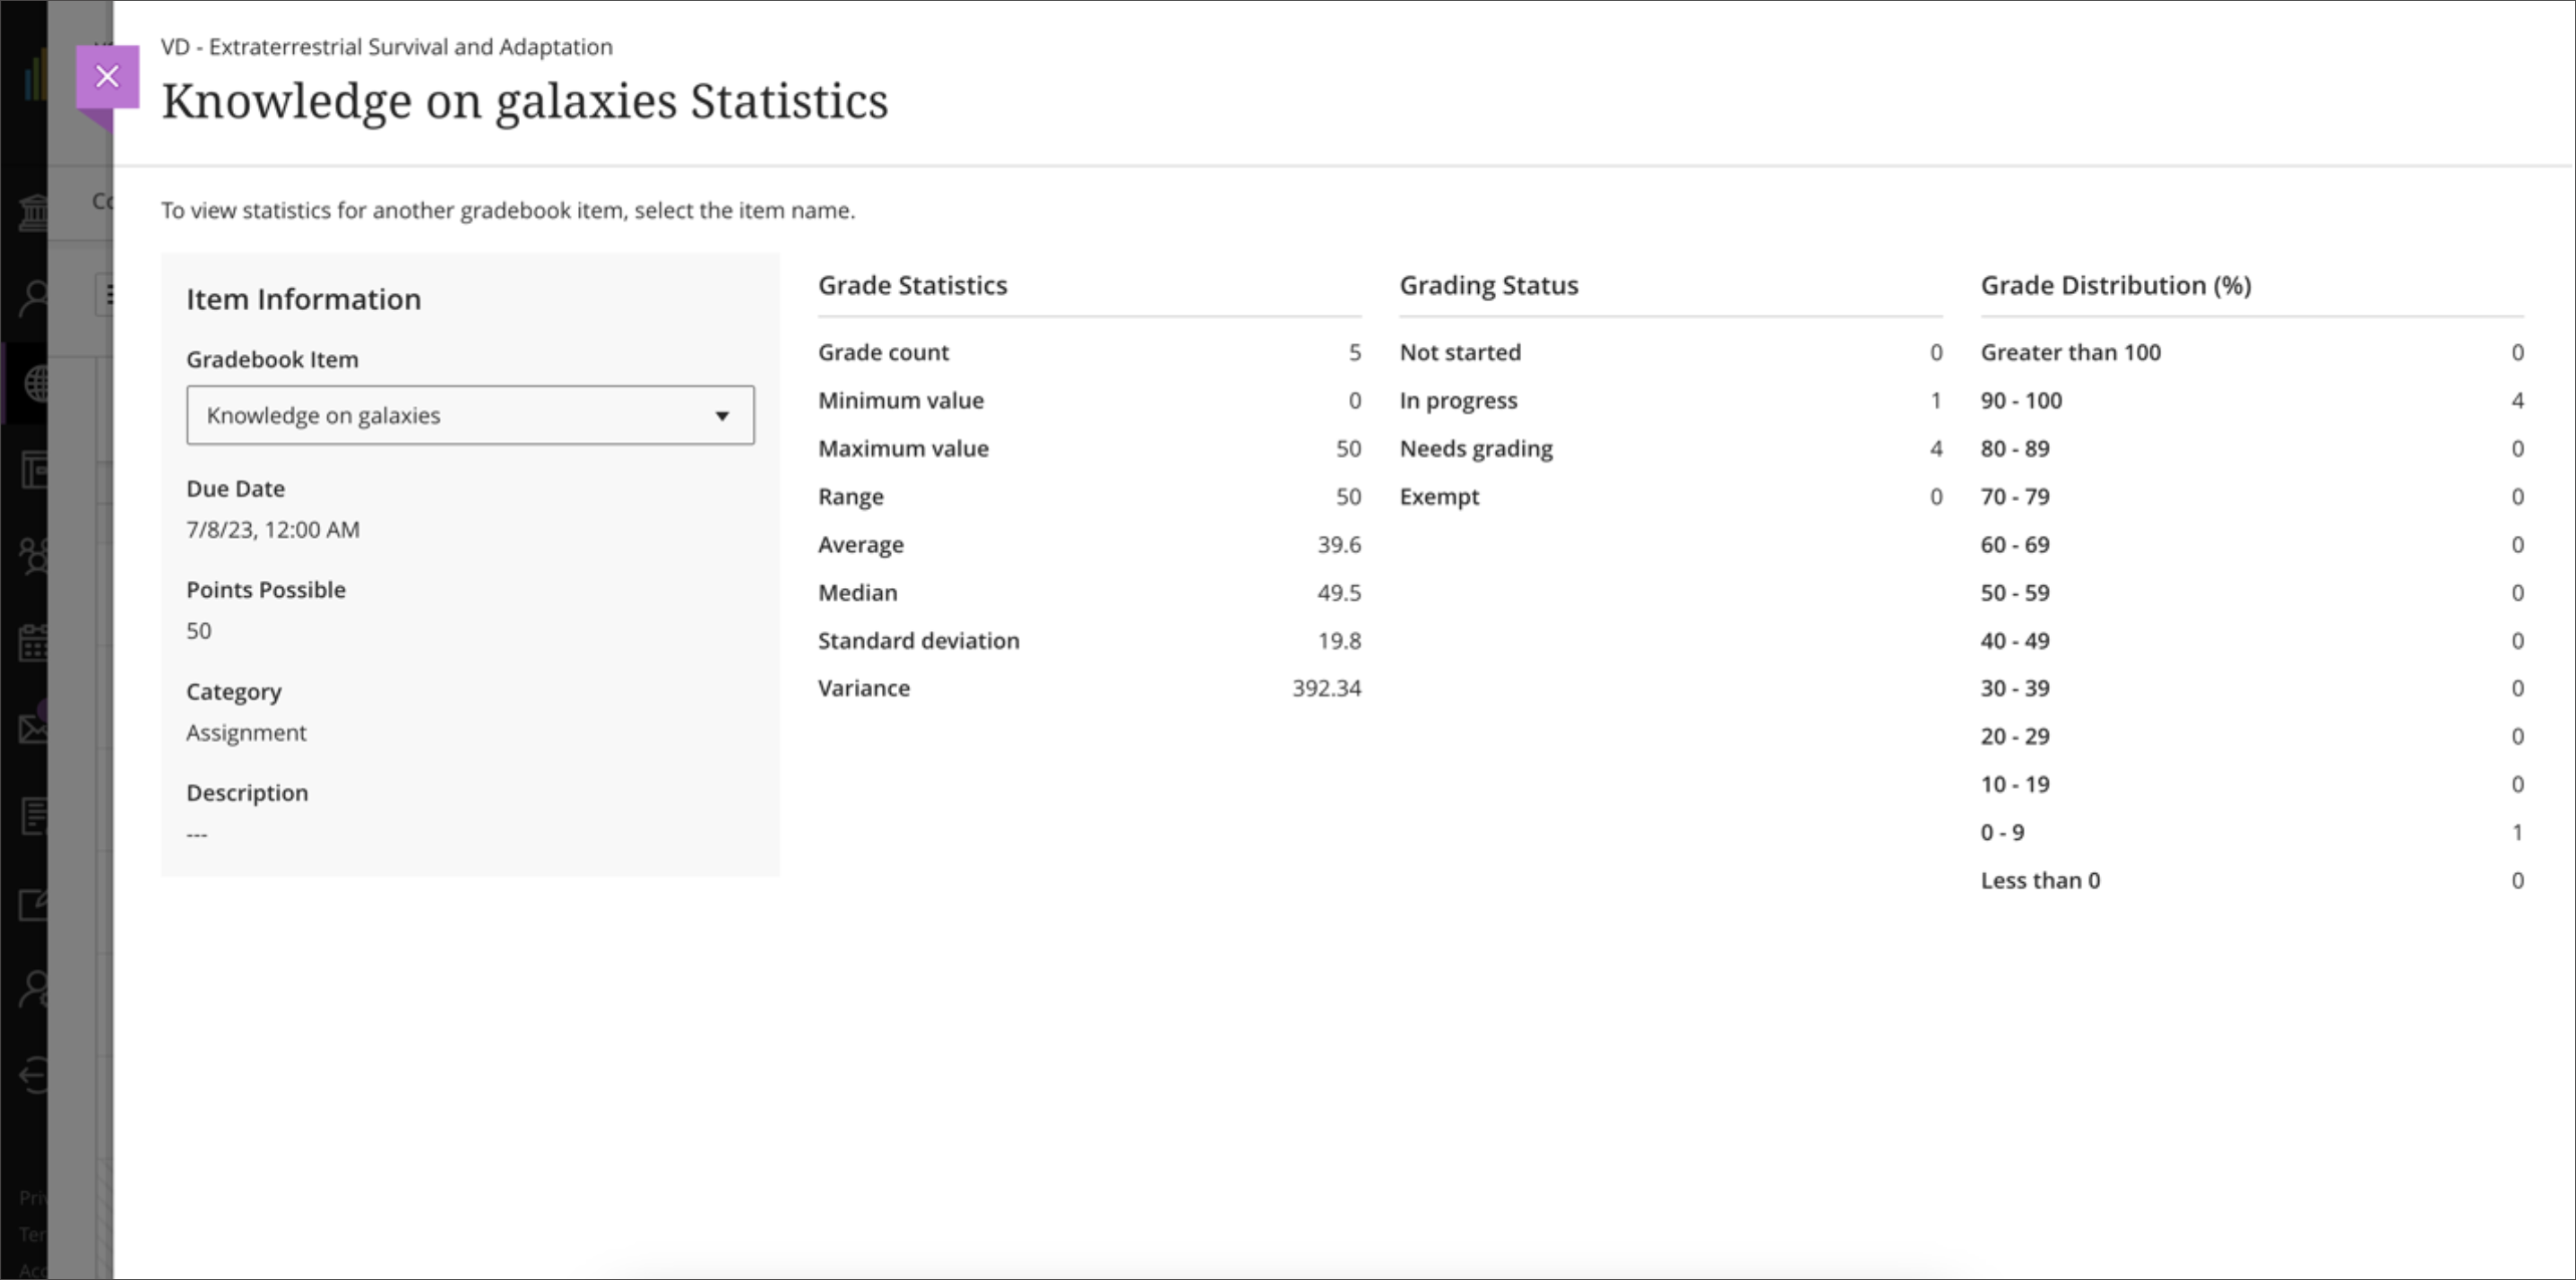
In the Statistics menu, you can view information such as: Minimum value, Maximum value, Range, Average, Median, Standard Deviation, Variance, and Grade Distribution.
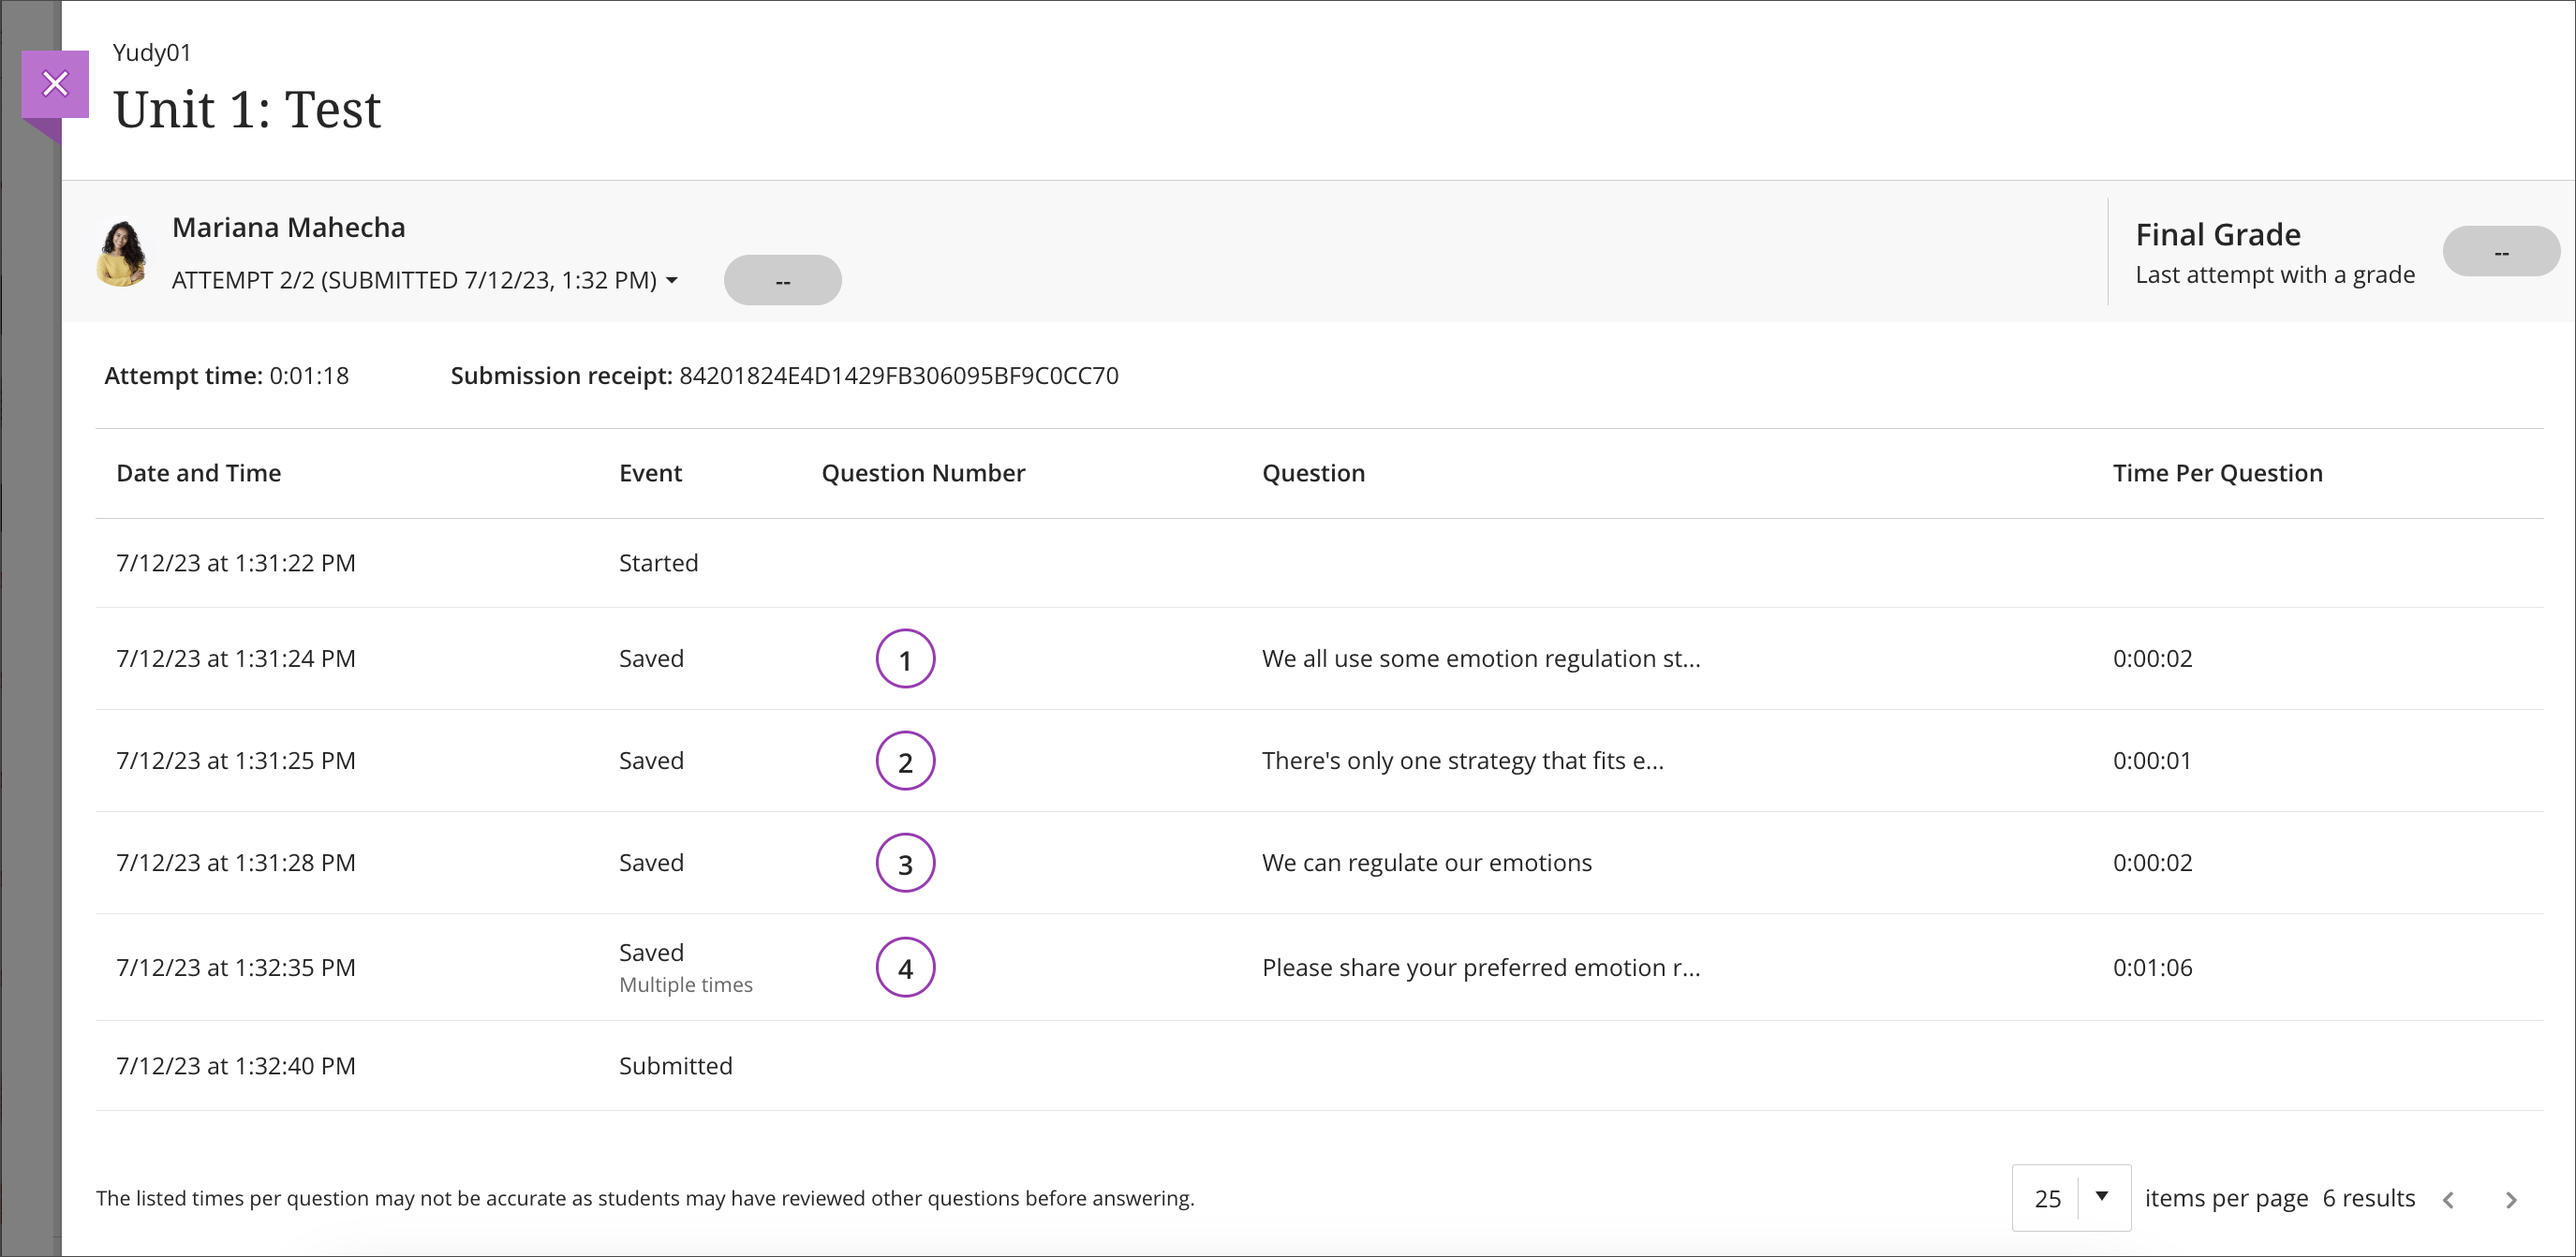
Attempt Logs
With attempt logs, instructors can view a log of student’s assessment submissions. For example, instructors can view:
-
Date and time of when students when students start an assessment.
-
Estimated time spent on each question.
-
Submission receipt numbers
-
Students' multiple attempts
-
If an assessment was auto-submitted (e.g. the timer ran out)
To access attempt logs, navigate to Gradebook > Click on assessment > Submissions > Click on the three dots (…) > Attempt Log.
Activity Log
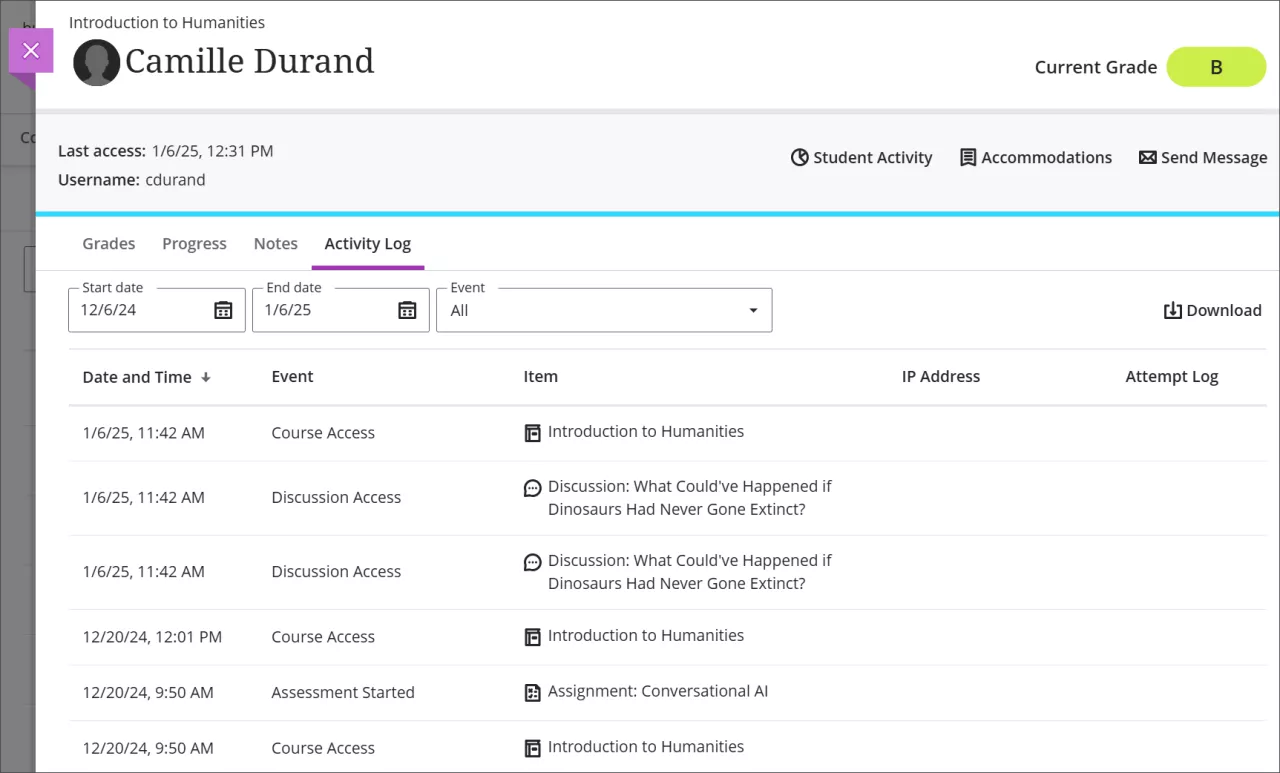
Student activity can help support decisions in academic disputes. Instructors can check what activity the student did in a course. IP addresses are also listed, which can be useful when reviewing test taking behaviour. This information is available for the past 140 days. Information past 140 days are not stored.
The Activity Log can be accessed via Gradebook > Students > student name > Activity Log. It can also be downloaded by clicking on the Download icon on the right.
Rubric Evaluation Report
Run a Rubric Evaluation Report directly from the gradebook for any graded activity that has an associated rubric.
Note: The report gets updated every 24 hours. If your downloaded reports is blank, please try again later.
To access the report, navigate to list view or grid view.
-
In List view, click the three dots to the right of the assessment and select Download rubric report.
-
In Grid view, click on the assessment title, and select Download rubric report.
Once generated the report provie the following sections:
-
Overview: Displays the assignment name, rubric name, rubric type, and the total number of student evaluations included in the report.
-
Rubric Overall Performance: Shows the average score students achieved against the total points possible, displayed as a summary value (for example, Average achieved score: 79.57 / 100).
-
Rubric Analysis: A bar graph comparing the points possible for each rubric criterion to the average points students earned.
-
Frequency Distribution: A table showing the percentage of students who achieved each level of performance for every criterion, along with statistical values including average, median, mode, and standard deviation.